

Health insurance company Cigna (NYSE:CI) reported Q1 CY2025 results topping the market’s revenue expectations, with sales up 14.4% year on year to $65.5 billion. Its non-GAAP profit of $6.74 per share was 6.2% above analysts’ consensus estimates.
Is now the time to buy Cigna? Find out by accessing our full research report, it’s free.
Cigna (CI) Q1 CY2025 Highlights:
- Revenue: $65.5 billion vs analyst estimates of $60.42 billion (14.4% year-on-year growth, 8.4% beat)
- Adjusted EPS: $6.74 vs analyst estimates of $6.35 (6.2% beat)
- Operating Margin: 2.8%, down from 3.9% in the same quarter last year
- Customers: 18.04 million, up from 17.5 million in the previous quarter
- Market Capitalization: $90.87 billion
"We are building a more sustainable health care model by successfully delivering on our series of commitments and actions to improve transparency and support for our customers and patients," said David M. Cordani, chairman and CEO of The Cigna Group.
Company Overview
With roots dating back to 1792 and serving millions of customers across the globe, The Cigna Group (NYSE:CI) provides healthcare services through its Evernorth Health Services and Cigna Healthcare segments, offering pharmacy benefits, specialty care, and medical plans.
Sales Growth
Examining a company’s long-term performance can provide clues about its quality. Any business can put up a good quarter or two, but many enduring ones grow for years. Luckily, Cigna’s sales grew at a decent 12% compounded annual growth rate over the last five years. Its growth was slightly above the average healthcare company and shows its offerings resonate with customers.
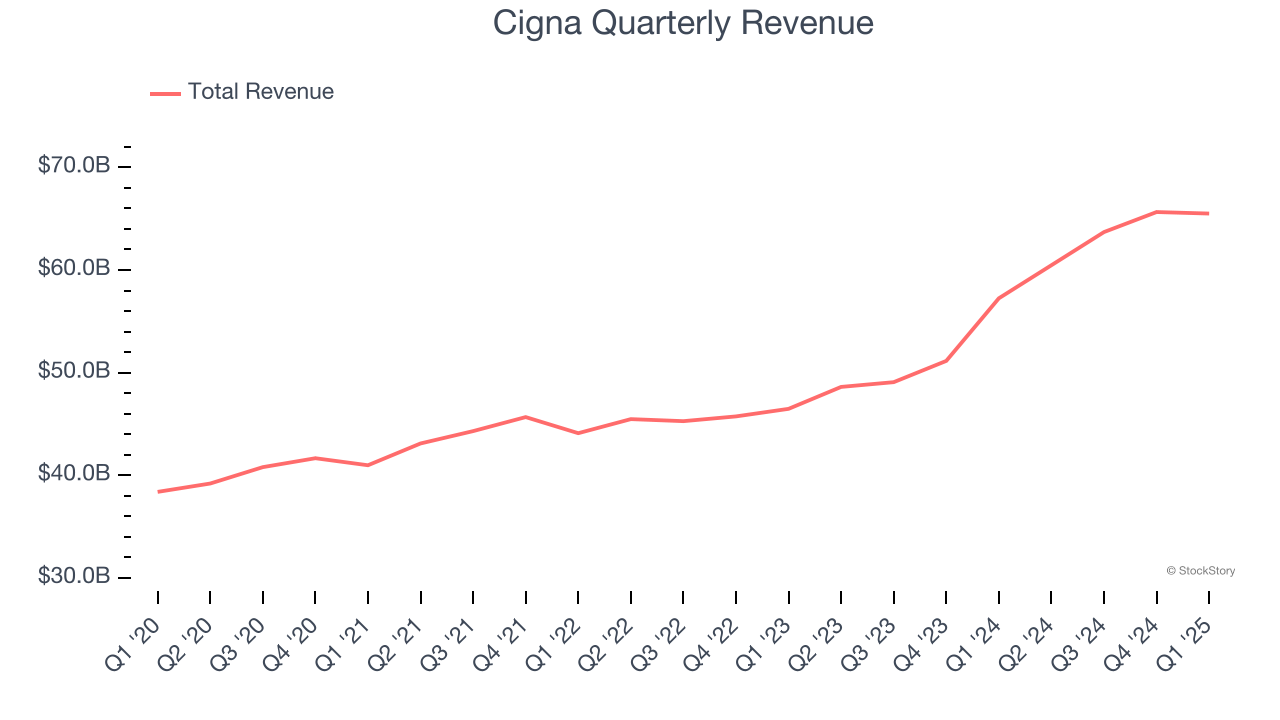
Long-term growth is the most important, but within healthcare, a half-decade historical view may miss new innovations or demand cycles. Cigna’s annualized revenue growth of 18.1% over the last two years is above its five-year trend, suggesting its demand recently accelerated. 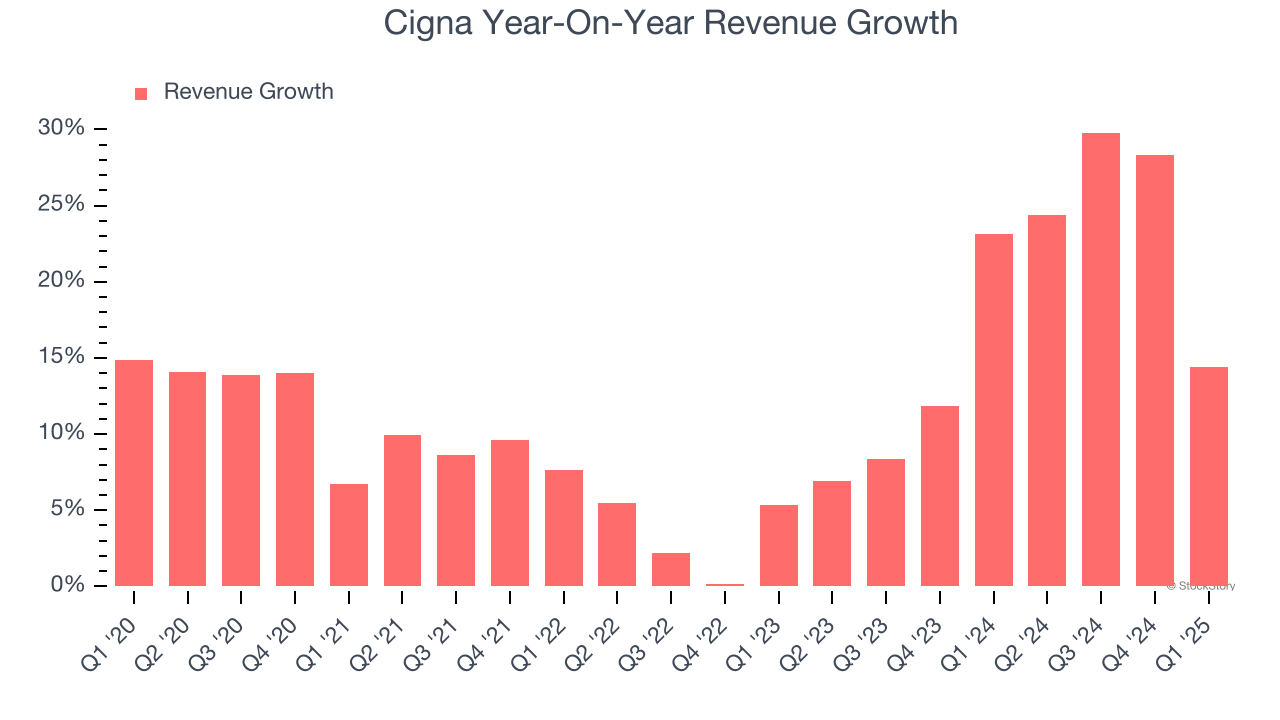
We can better understand the company’s revenue dynamics by analyzing its number of customers, which reached 18.04 million in the latest quarter. Over the last two years, Cigna’s customer base averaged 3.3% year-on-year growth. Because this number is lower than its revenue growth, we can see the average customer spent more money each year on the company’s products and services. 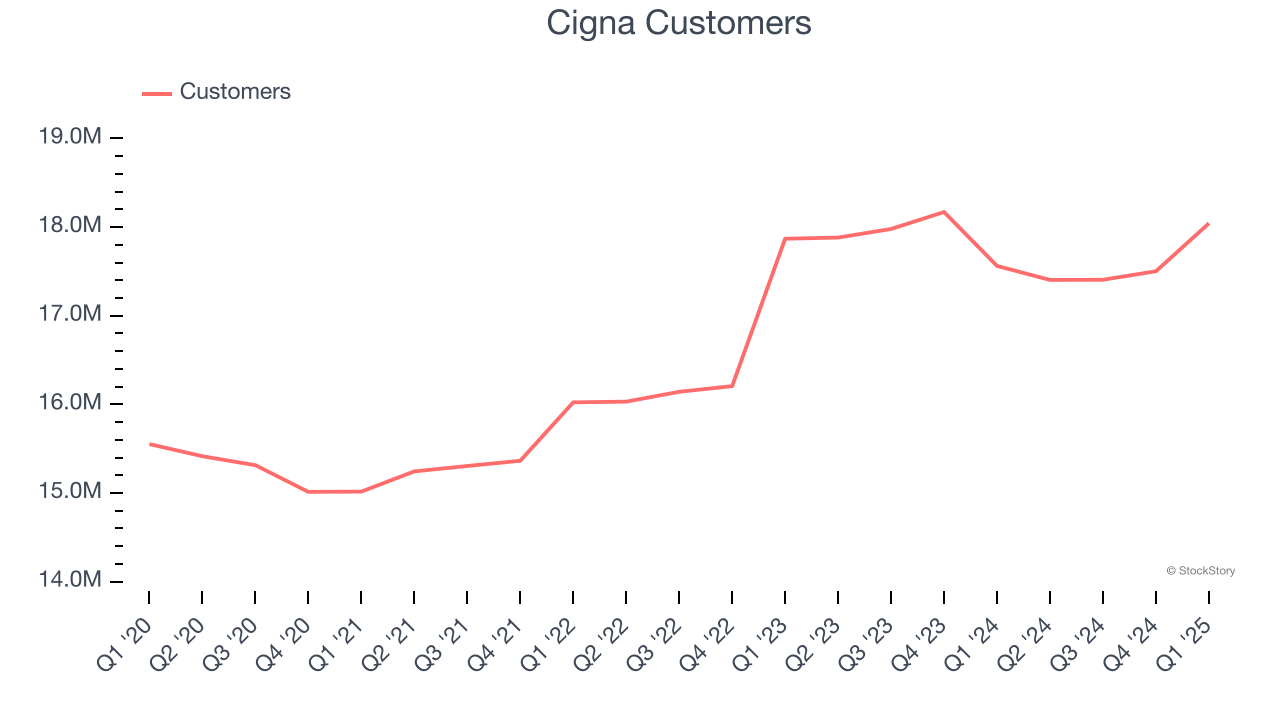
This quarter, Cigna reported year-on-year revenue growth of 14.4%, and its $65.5 billion of revenue exceeded Wall Street’s estimates by 8.4%.
Looking ahead, sell-side analysts expect revenue to remain flat over the next 12 months, a deceleration versus the last two years. This projection is underwhelming and implies its products and services will face some demand challenges. At least the company is tracking well in other measures of financial health.
Unless you’ve been living under a rock, it should be obvious by now that generative AI is going to have a huge impact on how large corporations do business. While Nvidia and AMD are trading close to all-time highs, we prefer a lesser-known (but still profitable) stock benefiting from the rise of AI. Click here to access our free report one of our favorites growth stories.
Operating Margin
Cigna was profitable over the last five years but held back by its large cost base. Its average operating margin of 4.3% was weak for a healthcare business.
Analyzing the trend in its profitability, Cigna’s operating margin decreased by 1.4 percentage points over the last five years. A silver lining is that on a two-year basis, its margin has stabilized. We like Cigna and hope it can right the ship.
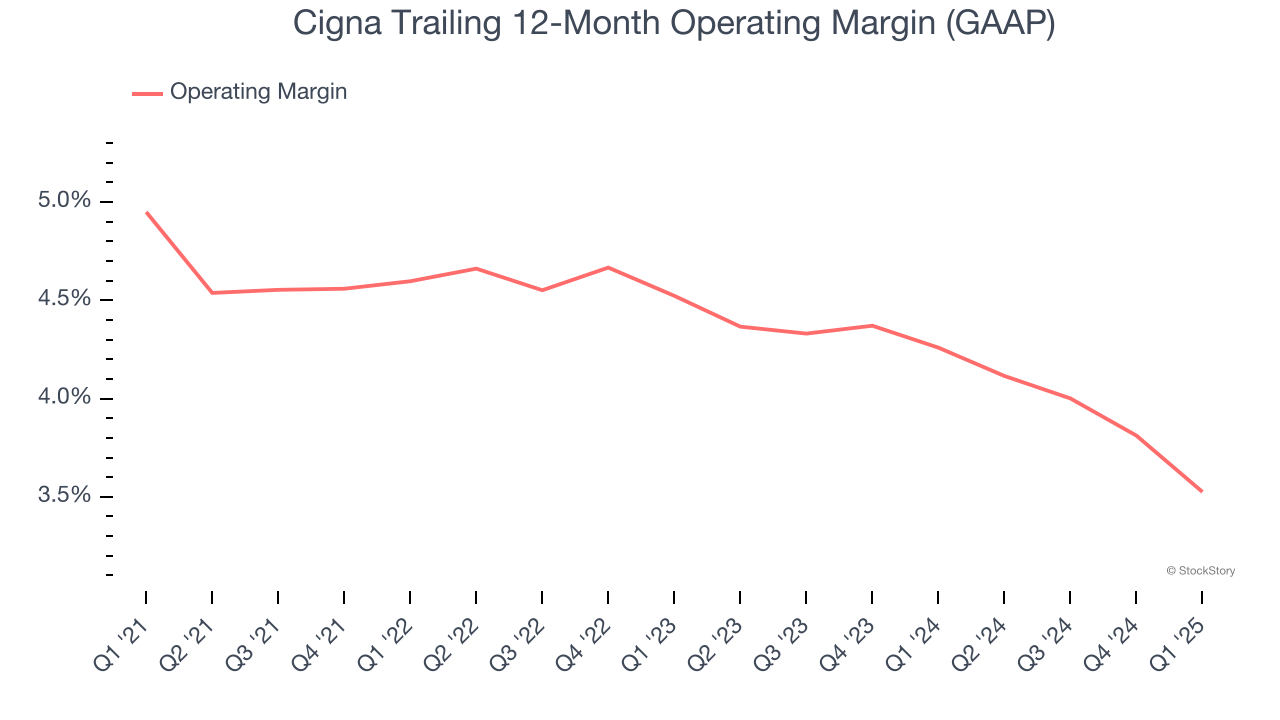
In Q1, Cigna generated an operating profit margin of 2.8%, down 1.1 percentage points year on year. This reduction is quite minuscule and indicates the company’s overall cost structure has been relatively stable.
Earnings Per Share
We track the long-term change in earnings per share (EPS) for the same reason as long-term revenue growth. Compared to revenue, however, EPS highlights whether a company’s growth is profitable.
Cigna’s EPS grew at a remarkable 9.1% compounded annual growth rate over the last five years. However, this performance was lower than its 12% annualized revenue growth, telling us the company became less profitable on a per-share basis as it expanded due to non-fundamental factors such as interest expenses and taxes.
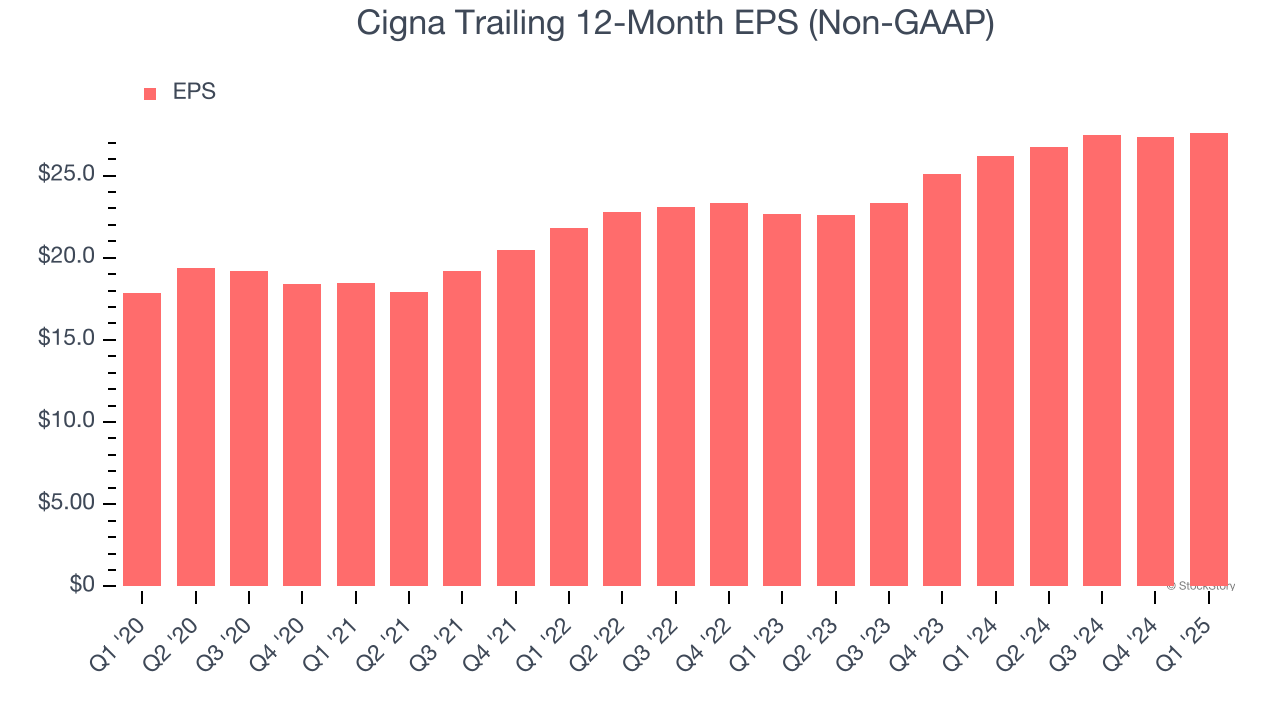
We can take a deeper look into Cigna’s earnings quality to better understand the drivers of its performance. As we mentioned earlier, Cigna’s operating margin declined by 1.4 percentage points over the last five years. This was the most relevant factor (aside from the revenue impact) behind its lower earnings; taxes and interest expenses can also affect EPS but don’t tell us as much about a company’s fundamentals.
In Q1, Cigna reported EPS at $6.74, up from $6.47 in the same quarter last year. This print beat analysts’ estimates by 6.2%. Over the next 12 months, Wall Street expects Cigna’s full-year EPS of $27.61 to grow 11.1%.
Key Takeaways from Cigna’s Q1 Results
We were impressed by how significantly Cigna blew past analysts’ customer base expectations this quarter. We were also excited its revenue outperformed Wall Street’s estimates by a wide margin. Zooming out, we think this was a solid print. The stock traded up 1.5% to $340 immediately after reporting.
Cigna put up rock-solid earnings, but one quarter doesn’t necessarily make the stock a buy. Let’s see if this is a good investment. When making that decision, it’s important to consider its valuation, business qualities, as well as what has happened in the latest quarter. We cover that in our actionable full research report which you can read here, it’s free.